




44% of Americans Can’t Afford the Basics, Pew Finds, With Lower-Income Adults Hit Hardest
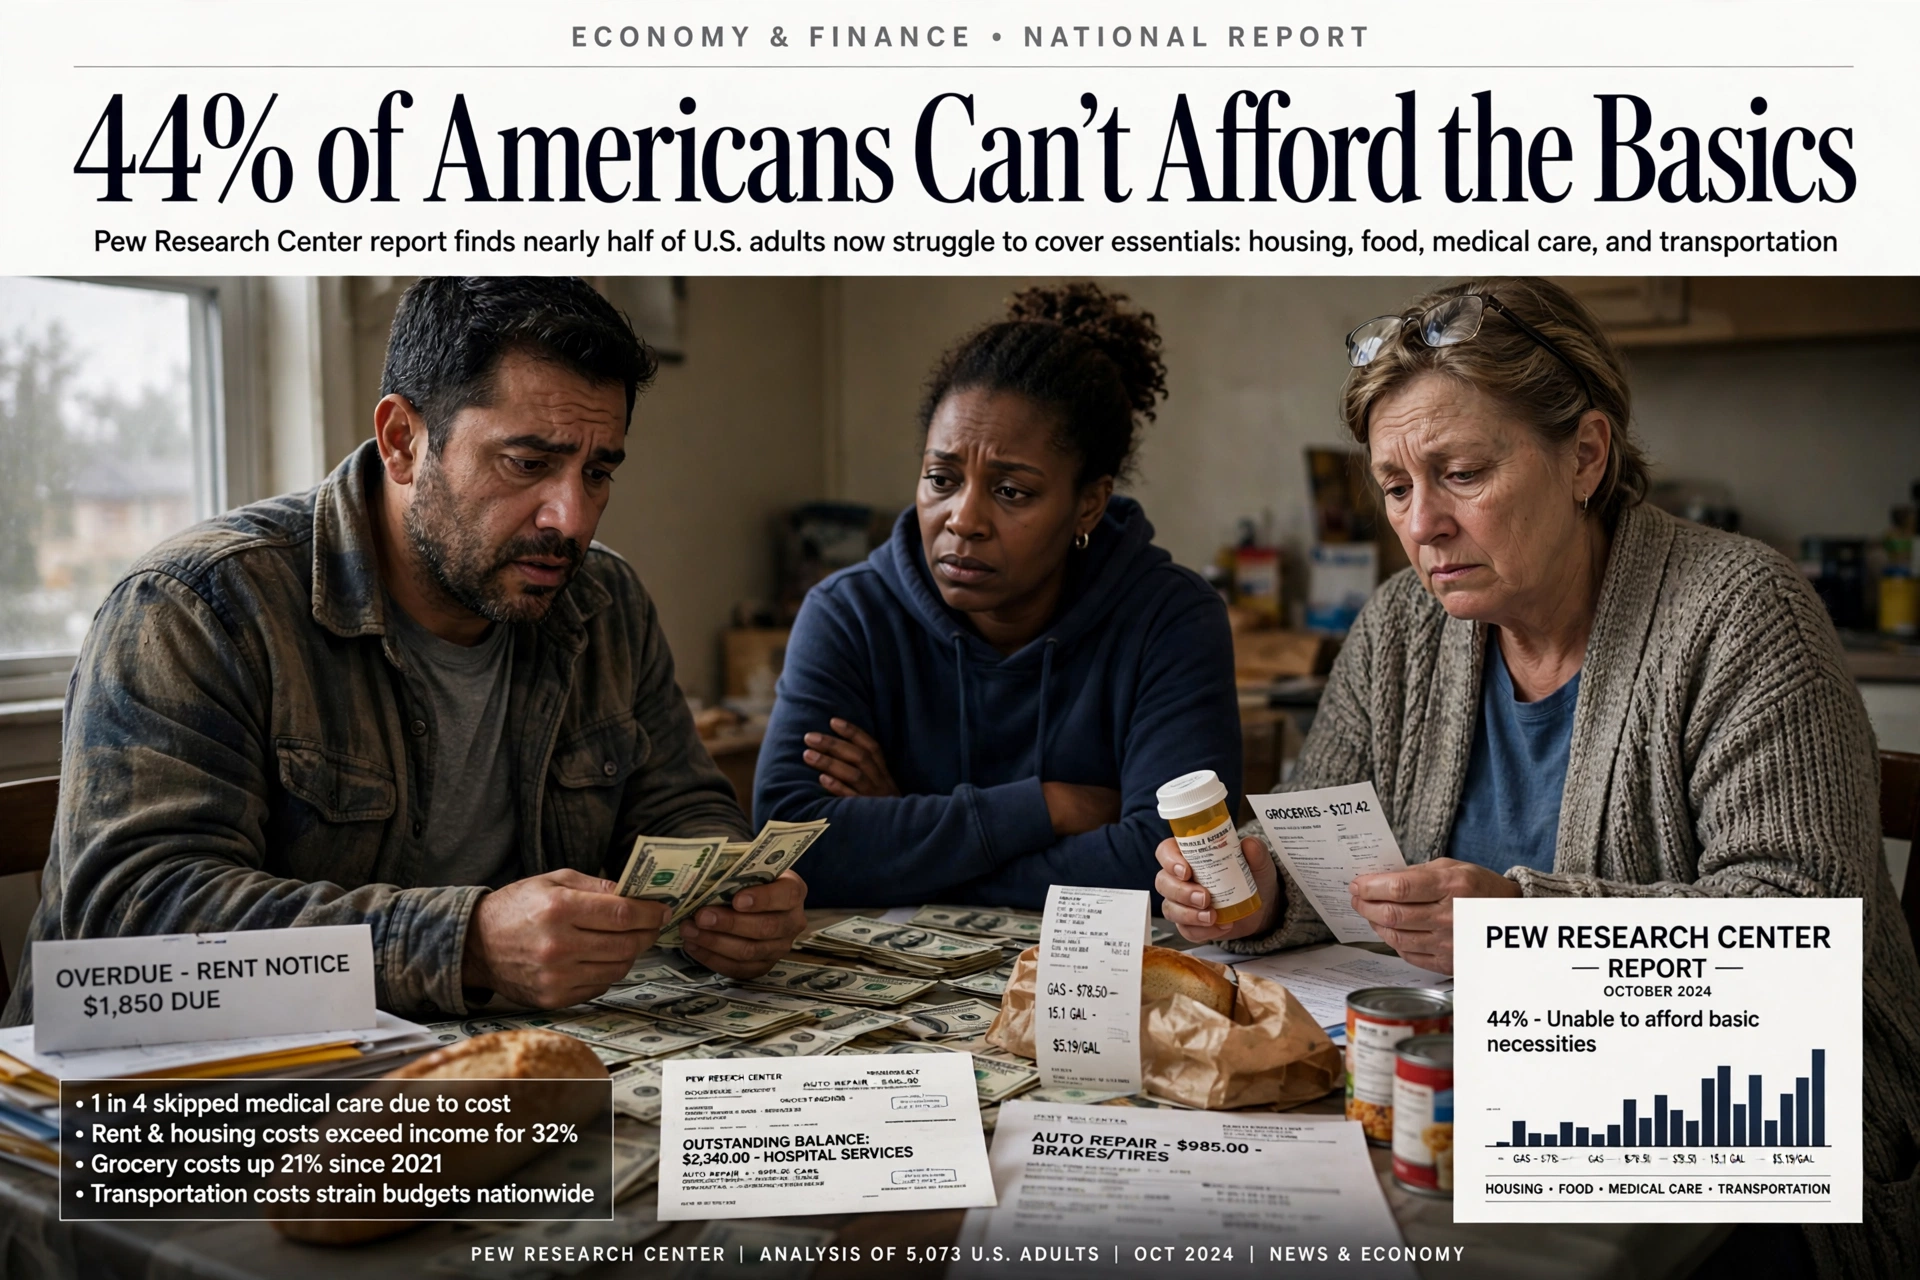
Nearly half of American adults struggled to pay for at least one basic necessity over the past year, according to a Pew Research Center analysis released Wednesday, October 14, 2026, a finding that lands two and a half weeks before midterm elections in which voters consistently name prices and affordability as their top concern. The survey of 5,166 U.S. adults, conducted August 24 to 30 with additional questions from a July 20 to August 9 wave, found that 44% of adults had trouble paying for medical care, transportation, housing or food at some point in the prior twelve months, and that the rate soared to 71% among lower-income adults.
Key Takeaways:
- – A Pew Research Center survey of 5,166 U.S. adults, conducted August 24 to 30 and released October 14, 2026, found 44% had trouble affording at least one basic necessity in the past year.
- – Among lower-income adults the share jumped to 71%, and the four strain points were medical care (28%), transportation (22%), housing (21%) and food insecurity (20%).
- – Coping strategies skew precarious: many households borrow, make partial payments or turn to food pantries to bridge the gap.
- – The Federal Reserve’s October Beige Book echoed the trend, describing cautious, price-sensitive consumer spending across most districts, weeks before midterms where affordability tops voter concerns.
The Four Necessities That Break Budgets
Pew measured four concrete necessities rather than asking a single abstract question about finances, and each one shows meaningful strain. Among all U.S. adults, 28% had trouble paying for medical care for themselves or their family, 22% had problems paying for daily transportation costs, 21% had problems paying rent or mortgage, and 20% got food from a food bank or food pantry in the past year. At least one of those four happened to 44% of adults, a composite that captures households which appear stable on paper but miss in one essential category.
The medical care figure is the largest single item, and it is the one that compounds. A household that delays a procedure or skips prescriptions to protect rent is trading future health costs against present cash flow, and 28% of adults reporting that tradeoff is the kind of number that surfaces later as emergency room utilization and medical debt. The transportation share matters for the same reason in reverse: jobs, childcare and groceries all depend on getting to them, and 22% of adults reporting transportation cost problems shows how a car repair or a gas price spike can cascade through a budget.
The Income Divide Is Enormous
Differences by income dominate nearly every measure in the survey. While 44% of all adults hit at least one of the four necessities, the rate was 71% among lower-income adults, 39% among middle-income adults and just 13% among upper-income adults. The same gradient holds item by item: 42% of lower-income adults had trouble paying for medical care versus 9% of upper-income adults, 42% struggled with transportation versus 4%, 39% with rent or mortgage versus 5%, and 42% used a food bank versus 2%.
Pew noted that financial challenges are also more common among women, Black and Hispanic adults, young adults and people without a four-year college degree, groups more likely to have lower family incomes, which explains part but not all of those gaps. Childcare follows the pattern: 19% of parents with children under 18 had trouble paying for childcare in the past year, including 30% of lower-income parents, 15% of middle-income parents and 6% of upper-income parents.
How Families Cope: Borrowing, Partial Payments and Pantries
The coping strategies in the data are expensive ones. Adults who struggled to afford a necessity were far more likely to have borrowed money from friends or family, 50% versus 8% of those who did not struggle, and far more likely to have taken out a payday or other short-term loan, 31% versus 4%. Those patterns held across income groups, meaning the borrowing spike is a feature of the hardship itself rather than of any one income tier.
Payment strain is similarly widespread. Fully 60% of adults say they do not currently have enough income to lead the kind of life they want, 53% do not have emergency funds covering three months of expenses, and 27% cannot pay some of their monthly bills or can only make partial payments in a typical month. Among lower-income adults, 49% cannot pay all their monthly bills, compared with 22% of middle-income and 7% of upper-income adults. Some 70% of adults cut back on spending for extras such as eating out, streaming services or other entertainment in the past year, and 54% have not been able to save money for the future.
Worry is persistent rather than occasional: 32% of adults say they worry every day or almost every day about the cost of healthcare and about the amount of debt they carry. That daily-worry share is a psychological number with economic consequences, because households under that kind of sustained stress pull back on discretionary spending, which is exactly the pattern the Federal Reserve documented in its latest Beige Book.
Feelings Are Mixed, Not Purely Pessimistic
Pew’s August 24 to 30 interviews also asked about emotional responses to personal finances, and the picture is genuinely split. Three in ten adults say they often feel stuck when thinking about their financial situation, while 37% say they often feel hopeful, 36% feel content, 18% often feel angry and 13% often feel ashamed. Looking forward, 41% say they are not too or not at all confident they will have enough income in the future to lead the kind of life they want, nearly double the 22% who are extremely or very confident.
Self-assessment remains more positive than the hardship numbers might predict: 58% of adults think they are doing better than most Americans at meeting their basic expenses, a optimism gap that shows up in economic sentiment surveys regularly. Partisan differences exist but are modest in income terms: Republicans and Republican-leaning independents are more likely than Democrats and Democratic leaners to say they have enough income for their desired life, 46% to 35%, to have saved for the future, 51% to 43%, and to pay all their bills in full each month, 78% to 69%.
What the Fed Is Seeing at the Same Time
The Pew release arrived one day after the Federal Reserve published its October Beige Book, and the two documents describe the same economy from different angles. The Fed’s district-by-district survey found little or no change in consumer spending in most districts, with auto sales flat to modestly lower in five of the six districts reporting, and it noted explicitly that spending was increasingly driven by higher-income households, the same split Pew measured at the household level.
Businesses in the Beige Book repeatedly cited higher oil and diesel prices, tariffs and insurance costs as pressures, the cost categories that feed directly into the transportation and housing strains Pew documented. Employment conditions were broadly little changed, with some districts reporting delayed hiring or reduced staffing after productivity investments, a description of a labor market that is neither creating the income growth households want nor collapsing.
Why This Matters Before the Midterms
Affordability is not a background issue in this cycle. Pew’s own survey work finds economic issues top of mind for voters as the midterms approach, with many specifically citing prices, and a separate Axios-Ipsos poll reported this week found 43% of Americans now support Medicare for all as healthcare costs mount, with supporters outnumbering opponents nearly two to one. Numbers like those give a texture to voter sentiment that headline inflation prints do not: the strain is less about a single inflation rate than about four separate necessities, any one of which can break a monthly budget.
For policymakers and businesses, the actionable read is that the consumer is not uniform. Upper-income spending supports the aggregate numbers the Fed cites, while lower-income households, 71% of whom hit a basic-necessity wall, are managing with food pantries, family borrowing and short-term loans. Companies oriented toward discretionary spending watch that divide carefully, because the 70% who have already cut back on extras are the same population advertisers and subscription businesses need to reach.
What to Watch
The next data points that will confirm or complicate Pew’s picture include the monthly jobs report and wage figures, the Fed’s next inflation readings, and the retail sales numbers that show whether holiday spending arrives with the same trimming behavior Pew documented. With the Beige Book already reporting spending concentrated among higher earners, the risk is a holiday season of two speeds. The steady signal in both reports is that affordability is now a structural condition for a large share of households, not a lingering aftereffect of any single price shock.
Conclusion
Pew’s finding that many Americans struggle to afford basics is not a forecast of collapse, but it is a precise map of where household budgets are breaking: in medical bills, in getting to work, in rent, and at the pantry door. The survey’s value is its concreteness, because those four categories translate directly into policy arguments and campaign messages heading into November’s midterms.
What happens next depends on prices and wages, and both datasets will be watched closely in the coming weeks, starting with the inflation reports and the Federal Reserve’s next policy meeting. For households, the coping patterns that Pew documented, borrowing, partial payments and food banks, are the early warning signs researchers look for before measured hardship rises, which is why this specific survey is likely to be quoted repeatedly through election season.
Frequently Asked Questions
What percentage of Americans struggle to afford basic necessities?
44% of U.S. adults had trouble paying for at least one of four basic necessities, medical care, transportation, rent or mortgage, or food, in the past year, according to a Pew Research Center analysis released October 14, 2026.
Which necessities are hardest to afford?
Among all adults, 28% had trouble paying for medical care, 22% for daily transportation, 21% for rent or mortgage, and 20% used a food bank or food pantry in the past year.
How much worse is it for lower-income households?
71% of lower-income adults had trouble with at least one basic necessity, compared with 39% of middle-income and 13% of upper-income adults, and 49% of lower-income adults cannot pay all their monthly bills.
What did the Federal Reserve’s Beige Book say about spending?
The October Beige Book, released October 14, 2026, found little or no change in consumer spending across most districts, with auto sales flat to lower in five of six reporting districts and spending increasingly driven by higher-income households.